Accessing the Dashboard
Click “Dashboard” in the sidebar navigation or navigate directly to/dashboard. The Dashboard is the default landing page after onboarding.
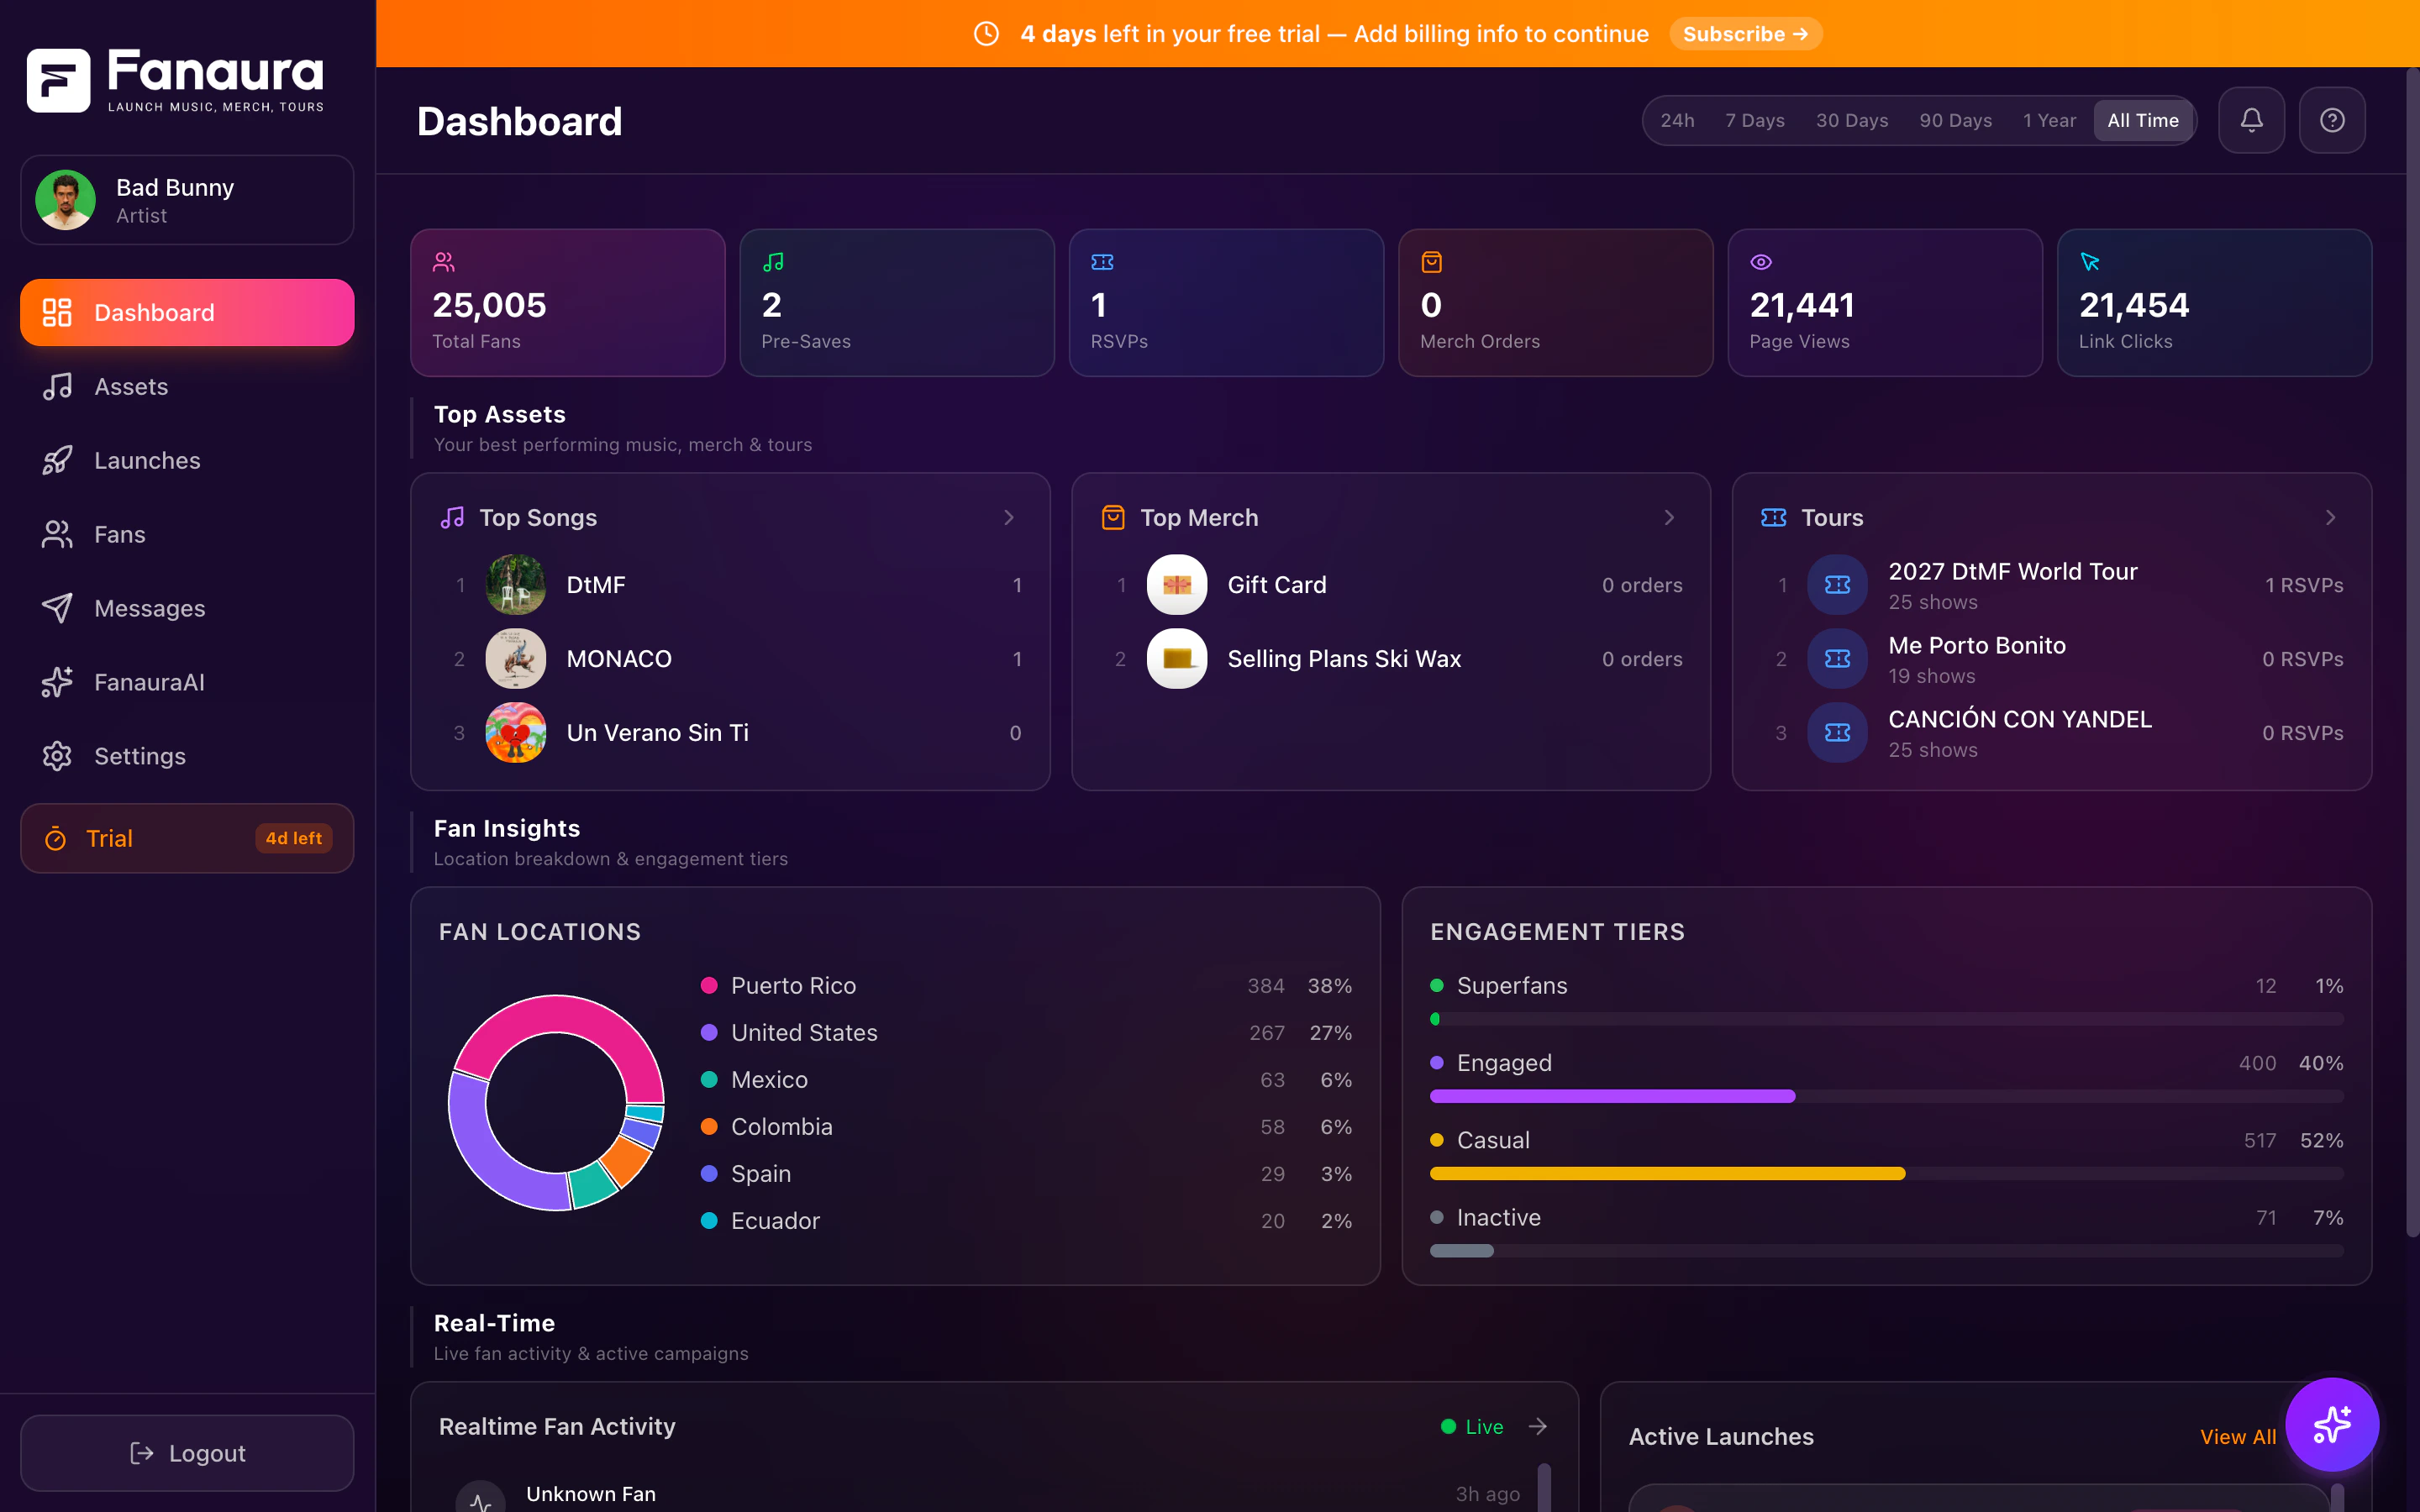
Page Layout
The Dashboard is organized into three main sections, from top to bottom:- Header with date range filter — control the time window for all data
- Fan Analytics — stat cards, charts, and insights
- Real-Time section — recent activity feed and active launches widget
Date Range Filter
In the page header (top-right area), you will find the date range selector. It is a row of pill-shaped buttons that let you control what time period all dashboard data covers.Available Ranges
| Button | Time Range | Best For |
|---|---|---|
| 24h | Last 24 hours | Checking how today is going |
| 7 Days | Last 7 days | Weekly check-in |
| 30 Days | Last 30 days | Monthly performance review |
| 90 Days | Last 90 days | Quarterly analysis |
| 1 Year | Last 365 days | Annual trends |
| All Time | Since account creation | The big picture |
The default range when you first open the Dashboard is All Time, so you see everything from day one.
Stat Cards
At the top of the analytics section, you will see a row of stat cards. On desktop, these display as 6 cards in a single row. On mobile, they wrap into 2 columns. The stat cards are powered by the FanAnalyticsTab component running in “overview” mode. They provide key performance indicators for your selected date range.Common Stats Displayed
- Total Fans — the total number of fans in your database
- New Fans — how many fans were added during the selected period
- Presaves — total presave count for the period
- Engagement Rate — the percentage of fans who have taken an action
- Top Source — the most common acquisition channel (presave, merch, RSVP, etc.)
- Active Campaigns — how many launches are currently running
- A label describing the metric
- A large, bold number or percentage
- A trend indicator (up/down arrow with percentage change from the previous period, where applicable)
Fan Analytics
Below the stat cards, the analytics section displays deeper insights. This section is powered by the same FanAnalyticsTab component used on the Fans page, but configured for the dashboard “overview” mode. Depending on your data, you may see:Fan Growth Chart
A line or area chart showing fan acquisition over time. The X-axis represents dates (days, weeks, or months depending on the selected range) and the Y-axis represents fan count. This is your most important trend indicator — a healthy fan base shows consistent upward growth.Top Assets
A ranking of your best-performing assets (music releases, merch products, tours) by fan engagement. Helps you see which content is driving the most fan growth.Geographic Insights
Where your fans are located. May show top cities or a distribution chart showing which regions have the highest concentration of fans.Platform Breakdown
Which platforms your fans are coming from — Spotify, Apple Music, direct smart link visits, Instagram, SMS, etc.Charts require a minimum amount of data to display. If you just started, some charts may appear empty until you have collected enough fan interactions.
Real-Time Section
Below the analytics section, a labeled section with an orange left border reads “Real-Time” with the subtitle “Live fan activity & active campaigns.” This section is split into two columns on desktop (3:2 ratio) and stacks vertically on mobile.Recent Activity Feed (Left Column)
The Recent Activity feed shows a live stream of fan actions happening right now. Each entry shows:- Fan name or identifier (e.g., “Sarah J.”)
- Action taken (e.g., “presaved Midnight Drive”, “signed up via SMS”, “purchased Luna Waves Tour Tee”)
- Timestamp (relative, e.g., “2 minutes ago”)
Active Launches Widget (Right Column)
A compact card showing your top 3 most recent active launches. Each launch entry shows:- Launch icon — color-coded by type (music note for music, map pin for tours, shopping bag for merch)
- Launch name — the title of the campaign
- Stage badge — the current stage in pill format (Pre-Release, Release, Post-Release)
- Fan stats — number of active fans and active flows
- Progress bar — a gradient bar (orange-to-pink) showing completion percentage
Real-Time Updates
The Dashboard uses real-time data subscriptions to stay current without requiring page refreshes. Here is what updates automatically:| Data Point | Update Mechanism |
|---|---|
| Stat card numbers | Refresh on date range change; real-time for new fans |
| Fan growth chart | Redraws when new data arrives |
| Recent activity feed | New entries slide in immediately via subscription |
| Active launches | Fan counters update as fans enter and complete flows |
This means you can leave the Dashboard open and watch your campaign perform in real time. It is like having a live dashboard at mission control.
Loading States
When the Dashboard first loads, you will see a clean loading skeleton:- Stat cards show as 6 gray pulsing rectangles in a row
- Chart area shows as 3 pulsing rectangles in a row
- Bottom section shows as 2 pulsing rectangles side by side
Dashboard Best Practices
Check It Daily
The Dashboard is designed for a quick daily glance. In under 10 seconds you can see:- How many new fans you gained
- Whether your active campaigns are progressing
- What the most recent fan activity is
Use the Date Range Strategically
- Use 24h on launch days to see real-time impact
- Use 7d for your weekly team meeting
- Use 30d when reporting to your label or manager
- Use All Time when evaluating overall growth
Share Screenshots With Your Team
The Dashboard is designed to be screenshot-friendly. The stat cards, charts, and activity feed all look clean and professional in screenshots — perfect for sharing in Slack, email, or social media.Keep Launches Active
The Dashboard is most useful when you have active campaigns running. An empty dashboard means no data is flowing. The best artists on Fanaura always have at least one active presave campaign or automation running to keep the fan pipeline moving.Troubleshooting
Dashboard shows all zeros
Dashboard shows all zeros
- You may not have any fans yet. Share your first smart link to start collecting data.
- Check that your date range is not too narrow (switch to “All Time” to see all data).
- Verify that you are viewing the correct artist (check the artist switcher in the sidebar).
Activity feed is empty
Activity feed is empty
- No fan actions have occurred in the selected time range.
- Real-time subscriptions require an active internet connection. Refresh the page if the feed seems stuck.
Charts are not loading
Charts are not loading
- The analytics component may still be fetching data. Wait a few seconds.
- If the issue persists, try refreshing the page.
- Some charts require a minimum amount of data to display (e.g., the growth chart needs at least 2 data points).
Next Steps
Active Launches
Deep-dive into the active launches widget and full launches page.
Fans
Explore your full fan database with profiles and conversations.
Launches
Create and manage your marketing campaigns.